
Page 55 - Monaco Economy 123
P. 55
Chaque année, la période estivale marque la hausse du taux d’occupation Each year, the summer period marks the increase in the occupancy rate
avec le retour des vacanciers. 2021 ne fait pas office d’exception. Au niveau with the return of holidaymakers and 2021 was no exception. Month by
mensuel, et depuis le début de l’année, le taux d’occupation a progressé par month since the beginning of the year, the occupancy rate has increased
rapport à l’année précédente. Les deux semestres se distinguent : alors que compared to the previous year. The two semesters differ: whilst he first
le premier reste très en deçà des niveaux observés en 2019, le second est remains well below the levels observed in 2019, the second is well above
largement supérieur à 2020 et se rapproche de celui de 2019. 2020 and approaching that of 2019.
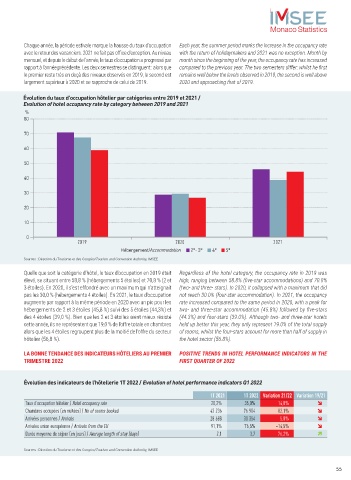
Évolution du taux d’occupation hôtelier par catégories entre 2019 et 2021 /
Evolution of hotel occupancy rate by category between 2019 and 2021
%
80
70
60
50
40
30
20
10
0
2019 2020 2021
Hébergement/Accommodation 2*- 3* 4* 5*
Sources : Direction du Tourisme et des Congrès/Tourism and Convention Authority, IMSEE
Quelle que soit la catégorie d’hôtel, le taux d’occupation en 2019 était Regardless of the hotel category, the occupancy rate in 2019 was
élevé, se situant entre 58,8 % (hébergements 5 étoiles) et 70,8 % (2 et high, ranging between 58.8% (five-star accommodations) and 70.8%
3 étoiles). En 2020, il s’est effondré avec un maximum qui n’atteignait (two- and three- stars). In 2020, it collapsed with a maximum that did
pas les 30,0 % (hébergements 4 étoiles). En 2021, le taux d’occupation not reach 30.0% (four-star accommodation). In 2021, the occupancy
augmente par rapport à la même période en 2020 avec un pic pour les rate increased compared to the same period in 2020, with a peak for
hébergements de 2 et 3 étoiles (45,8 %) suivi des 5 étoiles (44,3%) et two- and three-star accommodation (45.8%) followed by five-stars
des 4 étoiles (39,0 %). Bien que les 2 et 3 étoiles aient mieux résisté (44.3%) and four-stars (39.0%). Although two- and three-star hotels
cette année, ils ne représentent que 19,0 % de l’offre totale en chambres held up better this year, they only represent 19.0% of the total supply
alors que les 4 étoiles regroupent plus de la moitié de l’offre du secteur of rooms, whilst the four-stars account for more than half of supply in
hôtelier (56,8 %). the hotel sector (56.8%).
LA BONNE TENDANCE DES INDICATEURS HÔTELIERS AU PREMIER POSITIVE TRENDS IN HOTEL PERFORMANCE INDICATORS IN THE
TRIMESTRE 2022 FIRST QUARTER OF 2022
Évolution des indicateurs de l’hôtellerie 1T 2022 / Evolution of hotel performance indicators Q1 2022
1T 2021 1T 2022 Variation 21/22 Variation 19/21
Taux d’occupation hôtelier / Hotel occupancy rate 20,2% 35,0% 14,8%
Chambres occupées (en nuitées) / No of rooms booked 42 236 76 904 82,1%
Arrivées personnes / Arrivals 28 688 30 354 5,8%
Arrivées union européenne / Arrivals from the EU 91,1% 76,5% –14,5%
Durée moyenne de séjour (en jours) / Average length of stay (days) 2,1 3,7 76,2%
Sources : Direction du Tourisme et des Congrès/Tourism and Convention Authority, IMSEE
55